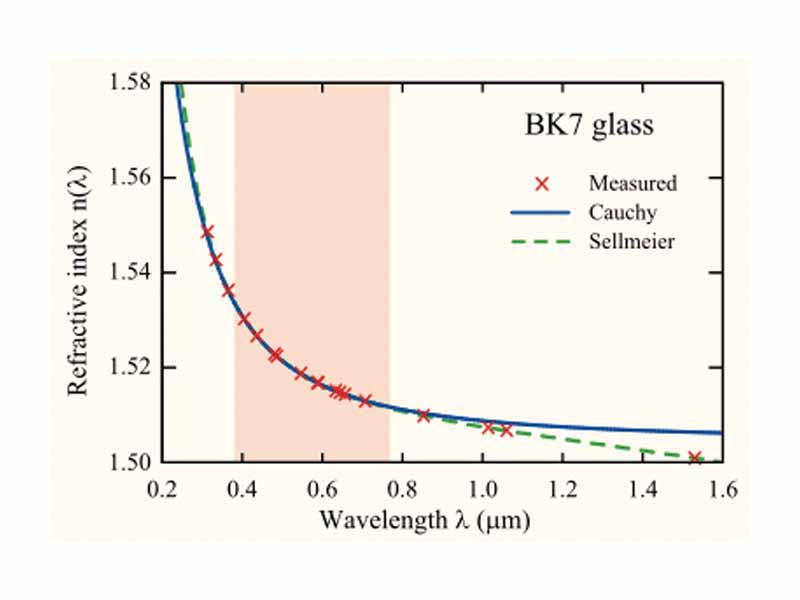
A plot of refactive index vs. wavelength for BK7 glass. Red crosses show measured values. Over the visible region (red shading), Cauchy's equation (blue line) agrees well with the measured refractive indices and the Sellmeier plot (green dashed line). It deviates in the ultraviolet and infrared regions.
Click this LINK to visit the original image and attribution information. Right click on the image to save the 800px teaching JPEG.