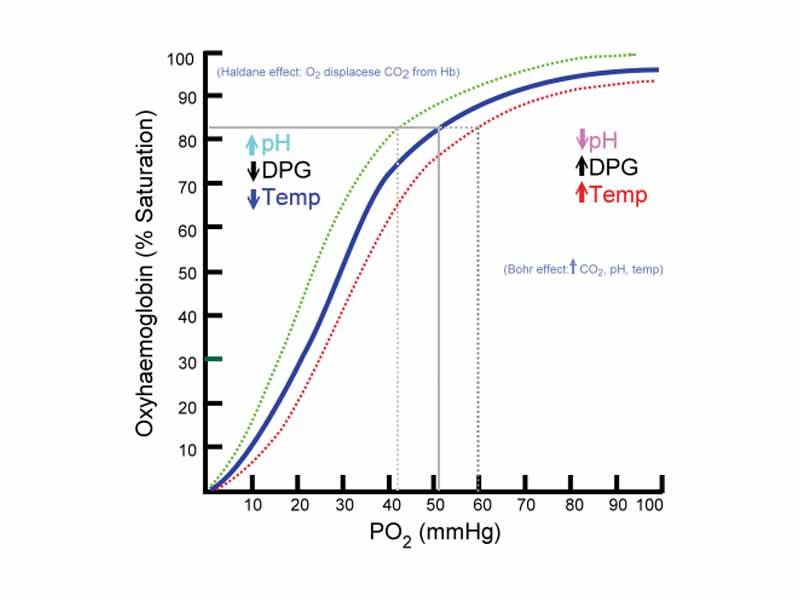
Oxyhaemoglobin Dissociation Curve. Dotted red line corresponds with shift to the right caused by Bohr effect.
Click this LINK to visit the original image and attribution information. Right click on the image to save the 800px teaching JPEG.
Click this LINK to visit the original image and attribution information. Right click on the image to save the 800px teaching JPEG.